

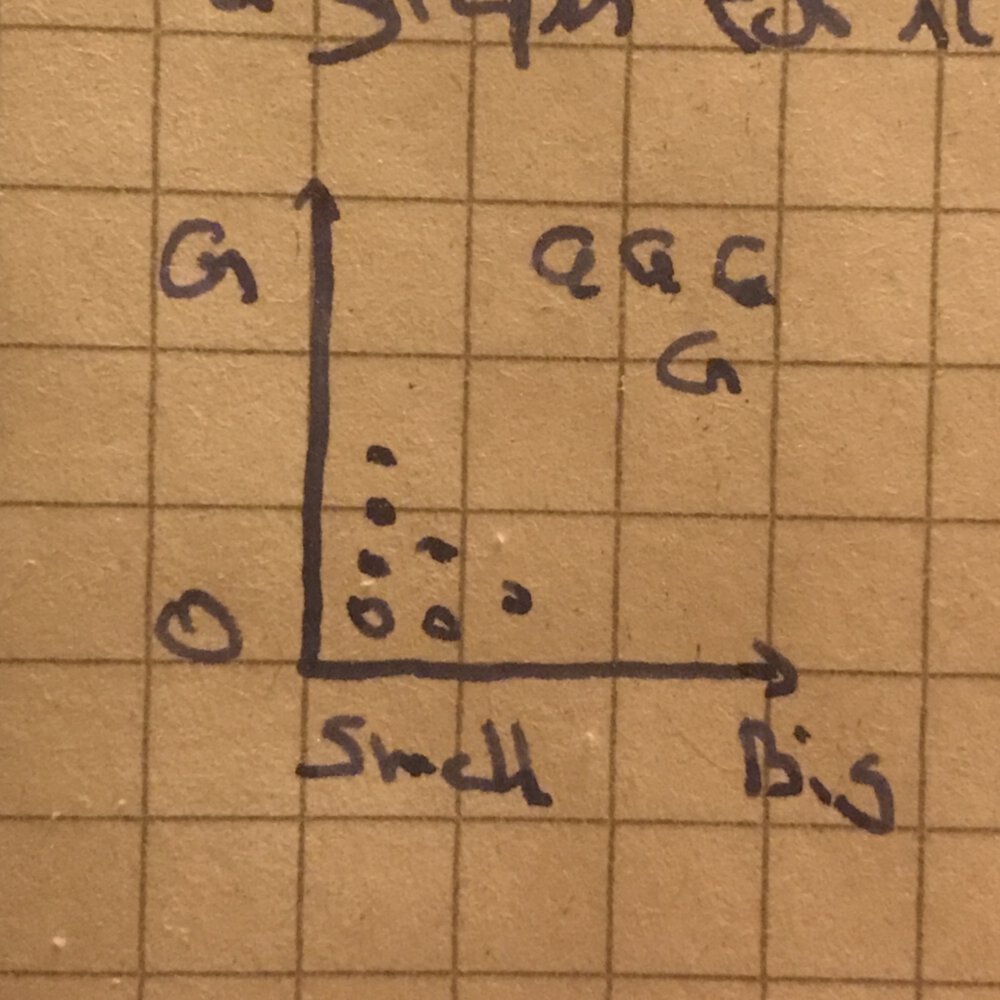
k-Nearest Neighbors is a classification algorithm. Assuming we want to decide if a fruit is an orange or a grapefruit, we can create a graph ploting different fruits based on their size.
Generally speaking, we can assume the bigger and redder a fruit is the likelier it is to be a grapefruit. Given an unknown fruit, we can classfify it using our graph. For that, we would plot our new fruit and based on its “neirest neighbor” we can decide if it is an orange or a grapefruit.
In the same way users of a shop can be plotted by the items they liked. Users with similar taste end up grouped closer to each other. Given a graph, we can use the features of an item to plot it. To find the distance between 2 points we can use the pythagorean formula.
For example, if we have users who rate movies, we can make them rate movies based on categories. Each category’s rating is used to plot each user.
| User | Comedy | Drama | Action | Horror | Romance |
|---|---|---|---|---|---|
| Alexander | 5 | 3 | 4 | 2 | 1 |
| David | 2 | 5 | 3 | 1 | 5 |
For Alexander we would get a 5-dimensional plot with the following coordinates
(5, 3, 4, 2, 1) for which we can use the same formula.
Regression is the process of predicting a response based on available data.
When working with k-Nearest Neighbor is is important to pick good features to compare against. This means features that correlate to the data and that don’t have bias.